Op27: Difference between revisions
| Line 78: | Line 78: | ||
[[File:op27-fluxfunction.png|500px|thumb|center|Adding the display of the flux function.]] | [[File:op27-fluxfunction.png|500px|thumb|center|Adding the display of the flux function.]] | ||
== Event labeling == | |||
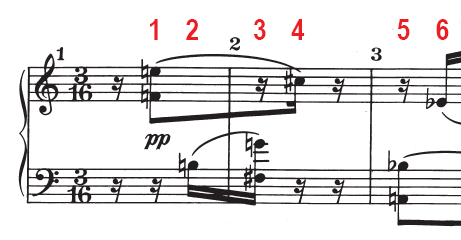
Time instants automatically detected by the <i>Spectral Reflux Onset Times</i> plugin need to be cleaned so that there is only one onset for each score event. Here is the opening of the first movement showing the first six <i>events</i> in the score: | |||
[[File:op27-scoreevents.png|500px|thumb|center|First six score events.]] | |||
Revision as of 06:42, 18 January 2012
This page describes data entry and processing for performances of Webern's Piano Variations, Op. 27.
Install Software
Download Sonic Visualiser
Download Sonic Visualiser (current version 1.9) from http://sonicvisualiser.org/download.html for either Windows or Linux. In Windows, unzip the downloaded program installation file and store the executable in any location on your computer.
Download Mazurka Plugings
Next, create the directory C:\Program Files\Vamp Plugins. On a 64-bit Windows computer, instead create the directory C:\Program Files (x86)\Vamp Plugins. Then download the file http://sv.mazurka.org.uk/download/windows/mazurka-plugins.dll from the webpage http://sv.mazurka.org.uk/download and save the dll file in the newly created directory.
Verify Installation
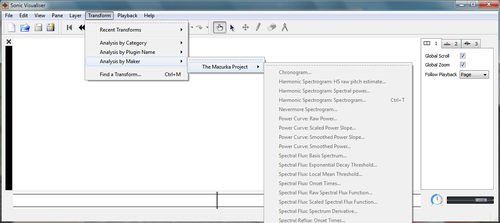
Double-click on the executable for Sonic Visualsier. Then go Transform → Analysis by Maker → The Mazurka Project. You should see a list of plugin options as shown in the plugin below (click three times on the image for full size):
Using the Mazurka Plugins
Here is a step-by-step description of how I load an audio file and add plugin data on to various layers in Sonic Visualiser.
Load an audio file
Load and audio file by going to File → Open... (or type Ctrl+O as a keyboard shortcut to open a file). Select an audio file from the file browsing window which appears. If the audio file is in stereo, the display in Sonic Visualiser after loading will look like this:
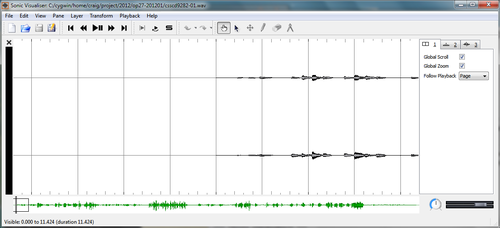
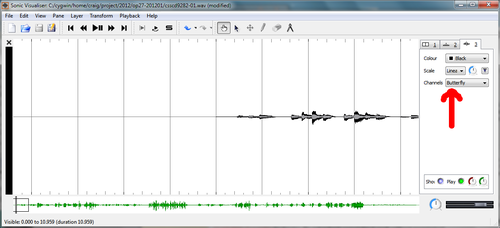
Since stereo information will not be important, switch to a monophonic display. To do this, click on the Waveform tab at the far right of the main display pane. For this particular example, it is the third tab which you can also open with the keyboard shortcut Alt+3. When the waveform options are display, select Butterfly or Mean instead of Separate. Refer to the red arrow in the following image which points to the change:
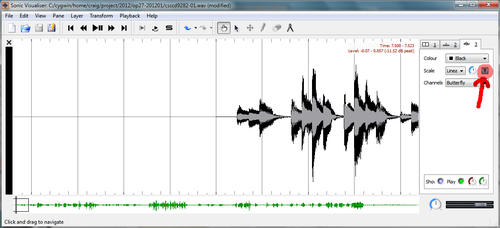
Also select the Normalize Visible Area button which is just above and to the left of the Butterfly text in the Waveform options panel. This setting will automatically scale up quiet waveforms and scale down loud waveforms so that the full range of the display pane shows the waveform amplitude. See the following figure which has the red arrow pointing to the normalization button:
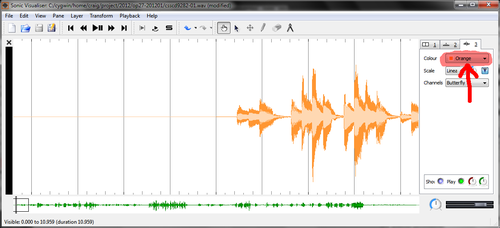
An optional setup is to change the waveform color to orange. I do this to minimize the waveform display so that plugin analysis data is more visible:
Running the plugins
Now you are ready to run the plugins. The primary plugin to use is Spectral Reflux...Onset Times. This plugin places a time instant at every location in the file which the plugin things is a note onset (or more precisely, an event where the spectral energy changes significantly). To run this plugin go to Transform → Analysis by Plugin Name → Spectral Reflux → Onset Times... (It will also be found in Transform → Recent Plugins after you have used it).
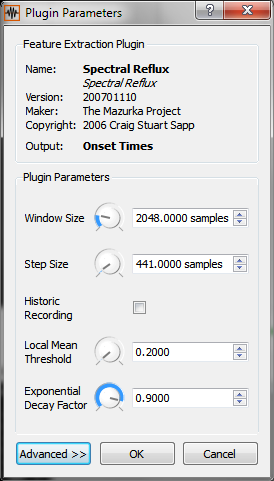
A parameter control window for the plugin will appear, as shown below. I almost always use the default settings. So just press the OK button to start the analysis.
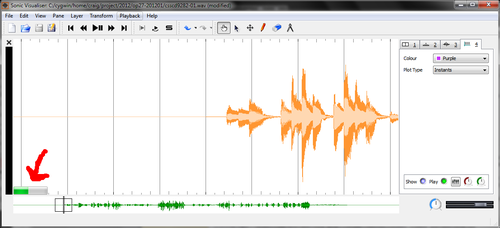
You will see a green progress bar in the lower left corner of the main pane while the plugin is working. It is probably best if you do not do anything in the editor while the plugin is working, as this will slow down the processing or may hang the program (depending on the version of Sonic Visualiser).
Once the plugin has completed the analysis, you should see a set of vertical lines added to the display pane. In this case the lines are pink/purple. Notice that there is a new tab in the control panel on the right which is opened to the new time instants layer settings.
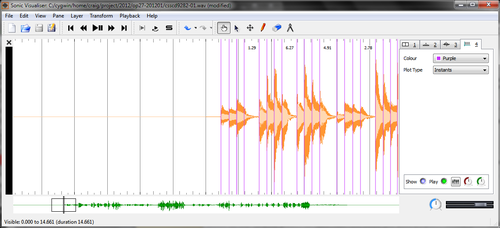
I also hide the display of the timeline vertical lines and ticks so that it is easier to concentrate on the onset time markers. Press the # key to toggle the timeline display:
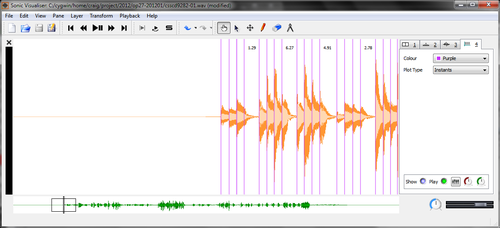
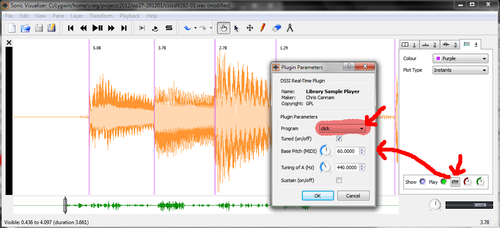
Try listening to the audio along with the clicks. Press the space bar to start playing the sound file. Whenever an onset line is crossed by the playback cursor, a tap sound is played. The default sound is loud and obnoxious. Change the default timbre for the sound of time instants on the layer to click by pressing on the mixer button on the time instant layer as illustrated below, then select click from the Program drop-down list.
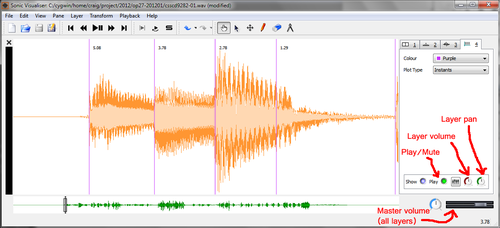
You can also adjust the loudness of the onset clicks by clicking on the layer volume know on the time instant control panel, and then moving mouse up/down or left/right to make the clicks louder or softer. For careful listening, I often put the clicks in one stereo channel and the original audio in another channel by panning the clicks with the panning know on its control panel, and then panning the audio waveform (click on the layer 3 tab to go to waveform control panel and pan in the opposite direction). Also note the global volume control for all audio output at the bottom right of the Sonic Visualiser window.
You can zoom in and out of the waveform as shown in the previous few illustrations by pressing the ↑ and ↓ arrow keys. Navigation forward and backwards in time can be done by pressing the ← and → arrow keys.
Spectral Reflux: Scaled Spectral Flux Function
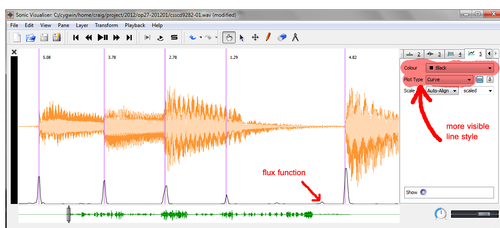
Another useful output of the Spectral Reflux plugin is the Scaled Spectral Flux Function output. This is the intermediate output from the Spectral Reflux plugin from which onset times are measured. The peaks in the flux function are interpreted as onset times. Sometimes an onset is missed because the peak does not exceed the triggering threshold. Seeing the function on-screen will help when you need to manually add a time instant in these cases.
Run the Transform → Analysis by Plugin Name → Spectral Reflux → Scaled Spectral Flux Function plugin. After the plugin has completed, change the line color to black and the Plot Type to Curve. This will generate a continuous black curve at the bottom of the waveform display. Notice that the purple onset times align with the peaks of the black function.
Event labeling
Time instants automatically detected by the Spectral Reflux Onset Times plugin need to be cleaned so that there is only one onset for each score event. Here is the opening of the first movement showing the first six events in the score:
